Closing the gap, part 2: Probability and profitability
Welcome back to the second post in this series looking at how we can improve the performance of RISC-V code from LLVM.
Previously in part 1
we looked at how we can use LNT to
analyze performance gaps, then identified and fixed a missed fmsub.d
opportunity during instruction selection, giving a modest 1.77%
speedup on a SPEC CPU 2017 benchmark.
In this post we’ll be improving another SPEC benchmark by 7% by teaching the loop vectorizer to make smarter cost modelling decisions. It involves a relatively non-trivial analysis, but thanks to LLVM’s modular infrastructure we can do it in just a handful of lines of code. Let’s get started.
Analysis
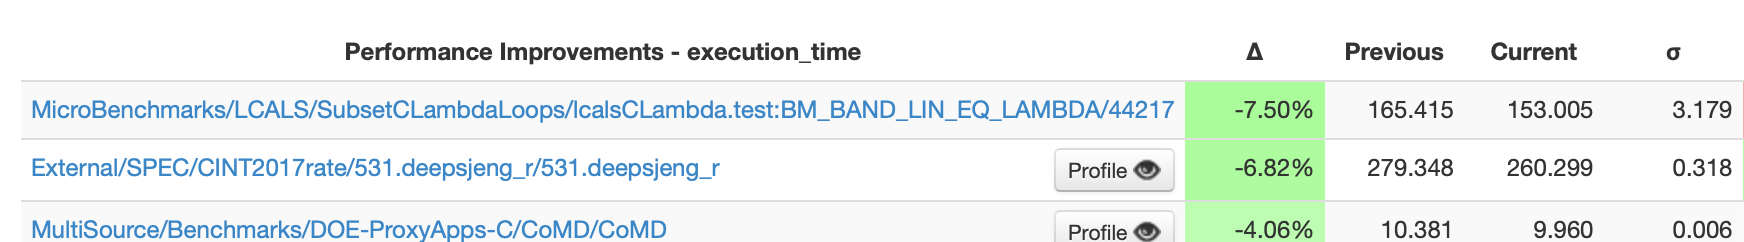
Just like last time, all fruitful performance work begins by analysing some workloads. In the last post we had already run some comparisons of SPEC CPU 2017 benchmarks on LNT, so we can return to those results and pick another benchmark to focus on. Here’s one that’s 12% slower than GCC:

531.deepsjeng_r is a chess engine that tied first in the World Computer Chess Championships back in 2009. It consists of a lot bitwise arithmetic and complex loops, since the state of the game is encoded in 64 element arrays: one element for each square on the board. Unlike 508.namd_r from last time, there’s no floating point arithmetic.
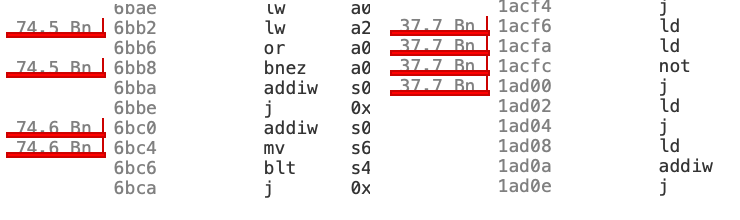
Drilling into the profile and its list of functions, right off the bat
we can see that one function is much slower on LLVM. On GCC
qsearch(state_t*, int, int, int, int) makes up 9.1% of the overall
cycles, but on LLVM it’s 16.1%. And if we click in on the function and
view the cumulative total of cycles spent in user mode, Clang takes
74.6 billion cycles to do what takes GCC only 37.7 billion cycles.
So there’s probably something we can improve upon here, but it’s not
immediately obvious from staring at the disassembly. qsearch is a
pretty big function with a couple hundred instructions, so switching
to the CFG view gives us a better overview.
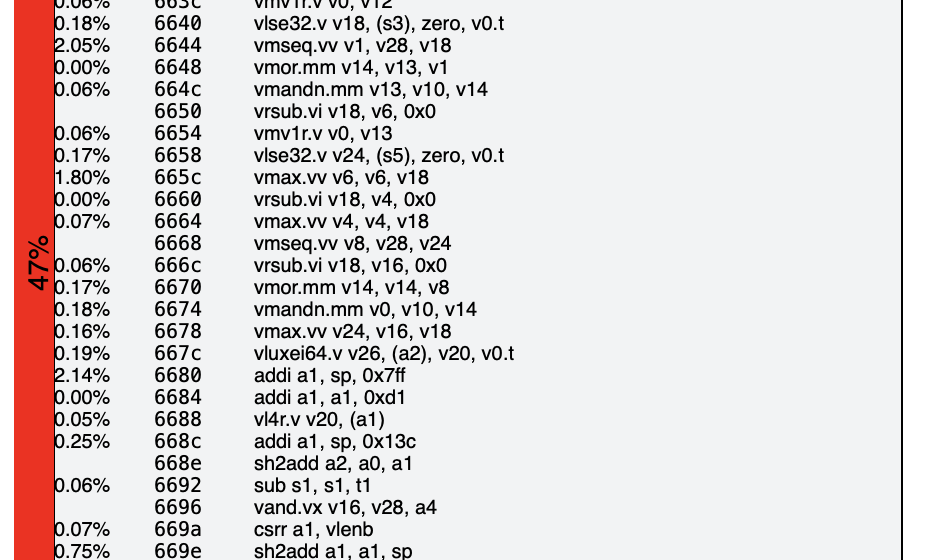
On LLVM’s side we see the offending loop that’s consuming so many
cycles: It’s long, vectorized, and completely if-predicated: there’s
no control flow inside the loop itself. This is typical of a loop
that’s been auto-vectorized by the loop vectorized. If you look at the
load and store instructions you can see that they are masked with the
v0.t operand, stemming from the original control flow that was
flattened.
But on the GCC side there’s no equivalent vectorized loop. The loop is in there somewhere, but all the loops are still in their original scalar form with the control flow intact. And if we look at the edges coming from the loop headers, we can see that most of the time it visits one or two basic blocks and then branches back up to the header. Most of the blocks in the loop are completely cold.
Unfortunately the sources for deepsjeng aren’t open source so we can’t share them in this post, but the very rough structure of the loop is something like this:
for (i = 0; i < N; i++) {
    if (foo[i] == a) {
        if (bar[i] == b) {
            if (baz[i] == c) {
                qux[i] = 123;
                // lots of work here...
            }
        }
    }
}
For any given iteration, it’s statistically unlikely that we enter the first if statement. It’s even more unlikely that the second if’s condition is also true. And even more so for the third nested if where we eventually have lots of work to compute.
In a scalar loop this doesn’t matter because if an if statement’s condition is false, then we don’t execute the code inside it. We just branch back to the start of the loop. But with a vectorized loop, we execute every single instruction regardless of the condition.
This is the core of the performance gap that we’re seeing versus GCC: Given that the majority of the work in this loop is so deeply nested in the control flow, it would have been better to have not vectorized it given that we need to if-convert it.
Cost modelling
One of the hardest problems when making an optimizing compiler is to know when an optimization is profitable. Some optimizations are a double edged sword that can harm performance just as much as they can improve it (if not more), and loop vectorization falls squarely into this category. So rather than blindly applying optimizations at any given opportunity, LLVM has detailed cost models for each target to try and estimate how expensive or cheap a certain sequence of instructions is, which it can then use to evaluate whether or not a transform will be a net positive.
It’s hard to overstate the amount of effort in LLVM spent fine tuning these cost models, applying various heuristics and approximations to make sure different optimizations don’t shoot themselves in the foot. In fact there are some optimizations like loop distribute that are in-tree but disabled by default due to the difficulty in getting the cost model right.
So naturally, we would expect that the loop vectorizer already has a sophisticated solution for the problem we’re seeing in our analysis: Given any predicated block that’s if-converted during vectorization, we would expect the scalar cost for that block to be made slightly cheaper because the scalar block may not always be executed. And the less likely it is to be executed, the cheaper it should be — the most deeply nested if block should be discounted more than the outermost if block.
So how does the loop vectorizer handle this?
/// A helper function that returns how much we should divide the cost of a
/// predicated block by. Typically this is the reciprocal of the block
/// probability, i.e. if we return X we are assuming the predicated block will
/// execute once for every X iterations of the loop header so the block should
/// only contribute 1/X of its cost to the total cost calculation, but when
/// optimizing for code size it will just be 1 as code size costs don't depend
/// on execution probabilities.
///
/// TODO: We should use actual block probability here, if available. Currently,
///       we always assume predicated blocks have a 50% chance of executing.
inline unsigned
getPredBlockCostDivisor(TargetTransformInfo::TargetCostKind CostKind) {
  return CostKind == TTI::TCK_CodeSize ? 1 : 2;
}
We’ve come across a load bearing TODO here. Either the block is executed or its not, so it’s a fifty/fifty chance.
On its own this hardcoded probability doesn’t seem like an
unreasonable guess. But whilst 50% may be an accurate estimate as to
whether or not a branch will be taken, it’s an inaccurate estimate
as to whether or not a block will be executed. Assuming that a
branch has a 1/2 chance of being taken, the most deeply nested block
in our example ends up having a 1/2 * 1/2 * 1/2 = 1/8 chance of
being executed.
for (i = 0; i < N; i++) {
    if (foo[i] == a) {
        // 1/2 chance of being executed
        if (bar[i] == b) {
            // 1/4 chance of being executed
            if (baz[i] == c) {
                // 1/8 chance of being executed
                // ...
            }
        }
    }
}
The fix to get the loop vectorizer to not unprofitably vectorize this
loop will be to teach getPredBlockCostDivisor to take into account
control flow between blocks.
It’s worth mentioning the fact that a hardcoded constant managed to work well enough up until this point is the sign of an good trade off. 1% of the effort for 90% of the benefit. A patch can go off the rails very easily by trying to implement too much in one go, so deferring the more complex cost modelling here till later was an astute choice. Incremental development is key to making progress upstream.
VPlan cost modeling
To get a better picture of how the loop vectorizer is calculating the cost for each possible loop, lets start with a simplified LLVM IR reproducer:
; for (int i = 0; i < 1024; i++)
;   if (c0)
;     if (c1)
;       p1[p0[i]] = 0; // extra work to increase the cost in the predicated block

define void @nested(ptr noalias %p0, ptr noalias %p1, i1 %c0, i1 %c1) {
entry:
  br label %loop

loop:
  %iv = phi i32 [ 0, %entry ], [ %iv.next, %latch ]
  br i1 %c0, label %then.0, label %latch

then.0:
  br i1 %c1, label %then.1, label %latch

then.1:
  %gep0 = getelementptr i32, ptr %p0, i32 %iv
  %x = load i32, ptr %gep0
  %gep1 = getelementptr i32, ptr %p1, i32 %x
  store i32 0, ptr %gep1
  br label %latch

latch:
  %iv.next = add i32 %iv, 1
  %done = icmp eq i32 %iv.next, 1024
  br i1 %done, label %exit, label %loop

exit:
  ret void
}
We can run opt -p loop-vectorize -debug on this example to see how the loop
vectorizer decides if it’s profitable to vectorize the loop or not:
$ opt -p loop-vectorize -mtriple riscv64 -mattr=+v nested.ll -disable-output -debug
...
LV: Found an estimated cost of 0 for VF 1 For instruction:   %iv = phi i32 [ 0, %entry ], [ %iv.next, %latch ]
LV: Found an estimated cost of 0 for VF 1 For instruction:   br i1 %c0, label %then.0, label %latch
LV: Found an estimated cost of 0 for VF 1 For instruction:   br i1 %c1, label %then.1, label %latch
LV: Found an estimated cost of 0 for VF 1 For instruction:   %gep0 = getelementptr i32, ptr %p0, i32 %iv
LV: Found an estimated cost of 1 for VF 1 For instruction:   %x = load i32, ptr %gep0, align 4
LV: Found an estimated cost of 0 for VF 1 For instruction:   %gep1 = getelementptr i32, ptr %p1, i32 %x
LV: Found an estimated cost of 1 for VF 1 For instruction:   store i32 0, ptr %gep1, align 4
LV: Found an estimated cost of 0 for VF 1 For instruction:   br label %latch
LV: Found an estimated cost of 1 for VF 1 For instruction:   %iv.next = add i32 %iv, 1
LV: Found an estimated cost of 1 for VF 1 For instruction:   %done = icmp eq i32 %iv.next, 1024
LV: Found an estimated cost of 0 for VF 1 For instruction:   br i1 %done, label %exit, label %loop
LV: Scalar loop costs: 3.
...
Cost of 1 for VF vscale x 4: induction instruction   %iv.next = add i32 %iv, 1
Cost of 0 for VF vscale x 4: induction instruction   %iv = phi i32 [ 0, %entry ], [ %iv.next, %latch ]
Cost of 1 for VF vscale x 4: exit condition instruction   %done = icmp eq i32 %iv.next, 1024
Cost of 0 for VF vscale x 4: EMIT vp<%4> = CANONICAL-INDUCTION ir<0>, vp<%index.next>
Cost of 0 for VF vscale x 4: EXPLICIT-VECTOR-LENGTH-BASED-IV-PHI vp<%5> = phi ir<0>, vp<%index.evl.next>
Cost of 0 for VF vscale x 4: EMIT-SCALAR vp<%avl> = phi [ ir<1024>, vector.ph ], [ vp<%avl.next>, vector.body ]
Cost of 1 for VF vscale x 4: EMIT-SCALAR vp<%6> = EXPLICIT-VECTOR-LENGTH vp<%avl>
Cost of 0 for VF vscale x 4: vp<%7> = SCALAR-STEPS vp<%5>, ir<1>, vp<%6>
Cost of 0 for VF vscale x 4: CLONE ir<%gep0> = getelementptr ir<%p0>, vp<%7>
Cost of 0 for VF vscale x 4: vp<%8> = vector-pointer ir<%gep0>
Cost of 2 for VF vscale x 4: WIDEN ir<%x> = vp.load vp<%8>, vp<%6>, vp<%3>
Cost of 0 for VF vscale x 4: WIDEN-GEP Inv[Var] ir<%gep1> = getelementptr ir<%p1>, ir<%x>
Cost of 12 for VF vscale x 4: WIDEN vp.store ir<%gep1>, ir<0>, vp<%6>, vp<%3>
Cost of 0 for VF vscale x 4: EMIT vp<%index.evl.next> = add nuw vp<%6>, vp<%5>
Cost of 0 for VF vscale x 4: EMIT vp<%avl.next> = sub nuw vp<%avl>, vp<%6>
Cost of 0 for VF vscale x 4: EMIT vp<%index.next> = add nuw vp<%4>, vp<%0>
Cost of 0 for VF vscale x 4: EMIT branch-on-count vp<%index.next>, vp<%1>
Cost of 0 for VF vscale x 4: vector loop backedge
Cost of 0 for VF vscale x 4: EMIT-SCALAR vp<%bc.resume.val> = phi [ ir<0>, ir-bb<entry> ]
Cost of 0 for VF vscale x 4: IR   %iv = phi i32 [ 0, %entry ], [ %iv.next, %latch ] (extra operand: vp<%bc.resume.val> from scalar.ph)
Cost of 0 for VF vscale x 4: EMIT vp<%3> = logical-and ir<%c0>, ir<%c1>
Cost for VF vscale x 4: 17 (Estimated cost per lane: 2.1)
...
LV: Selecting VF: vscale x 4.
LV: Minimum required TC for runtime checks to be profitable:0
LV: Interleaving is not beneficial.
LV: Found a vectorizable loop (vscale x 4) in nested.ll
LV: Vectorizing: innermost loop.
LEV: Unable to vectorize epilogue because no epilogue is allowed.
LV: Loop does not require scalar epilogue
LV: Loop does not require scalar epilogue
Executing best plan with VF=vscale x 4, UF=1
First we see it work out the cost of the original scalar loop, or as
the vectorizer sees it, the loop with a vectorization factor (VF)
of 1. It goes through each instruction calling into
TargetTransformInfo, and arrives at a total scalar cost of 3. You
might have noticed though, if you went through and manually summed up
the individual instruction costs you would have gotten a total cost
of 4. However the load and store instructions belong to the predicated
then.1 block, so they have their cost divided by 2 from
getPredBlockCostDivisor.
For the vectorized loop, the loop vectorizer uses
VPlan to cost the one
plan for a range of different VFs1. VPlan is an IR
specific to the loop vectorizer to help represent various
vectorization strategies, which is why you see all the EMIT and
WIDEN “recipes” in the output. It calculates a total cost for the
loop and divides it by the estimated number of lanes — we’re working
with scalable vectors on RISC-V so the target needs to make an
estimate of what vscale is — and arrives at 2.1 per lane. There’s
no predication discount applied here because it’s a vectorized
loop. 2.1 is cheaper than 3, so it ultimately picks the vectorized
loop.
BlockFrequencyInfo
Computing an accurate probability that a given block will be executed is a non-trivial task, but thankfully LLVM already has an analysis we can use for this called BlockFrequencyInfo.
BlockFrequencyInfo computes how often a block can be expected to
execute relative to other blocks in a function. It in turn uses
another analysis called BranchProbabilityInfo to work out how likely a
branch to a specific block is going to be taken. And because
BranchProbabilityInfo uses profiling information when available, it
can give you much more accurate block frequencies when compiling with
PGO. Otherwise
it will fall back to guessing the probability of a branch being taken,
which is just 50/50 a lot of the time, but sometimes influenced by
interesting heuristics too: like the probability of icmp eq i32 %x,
0 is 0.375 instead of 0.5, and floats have a near zero chance of
being NaN.
Plugging BlockFrequencyInfo into the loop vectorizer is straightforward, all we need to do is tell the pass manager that we want to access BlockFrequencyInfo from LoopVectorizePass:
PreservedAnalyses LoopVectorizePass::run(Function &F,
                                         FunctionAnalysisManager &AM) {
   ...
   BFI = &AM.getResult<BlockFrequencyAnalysis>(F);
   ...
}
(BlockFrequencyAnalysis is the pass that computes the analysis result BlockFrequencyInfo, if you’re wondering why the names are different)
Then we can use it to lookup the relative frequencies of whatever block and work out the probability of it being executed in the loop:
uint64_t LoopVectorizationCostModel::getPredBlockCostDivisor(
    TargetTransformInfo::TargetCostKind CostKind, const BasicBlock *BB) {
  if (CostKind == TTI::TCK_CodeSize)
    return 1;

  uint64_t HeaderFreq =
      BFI->getBlockFreq(TheLoop->getHeader()).getFrequency();
  uint64_t BBFreq = BFI->getBlockFreq(BB).getFrequency();
  return HeaderFreq / BBFreq;
}
The frequencies returned from BlockFrequencyInfo are relative to the the entry block of a function. So if a block has a frequency of 50 and the entry block has a frequency of 100, then you can expect that block to execute 50 times for every 100 times the entry block is executed.
You can use this to work out probabilities of a block being taken in a function, so in this example that block has a 50/100 = 50% chance of being executed every time the function is executed. However this only works in the case that the CFG has no loops: otherwise a block may be executed more times than the entry block and we’d end up with probabilities greater than 100%.
If we want to calculate the probability of a block being executed inside a loop though, that’s fine since the loop vectorizer currently only vectorizes inner-most loops2, i.e. loops that contain no other loops.
We can consider the frequencies of each block in the loop relative to the frequency of the header block. To give a brief loop terminology recap, the header is the first block inside the loop body which dominates all other blocks in the loop, and is the destination of all backedges. So the header is guaranteed to have a frequency greater than or equal to any other block in the loop — this invariant is important as we’ll see later.

Then to calculate the probability of a block in a loop being executed, we divide the block frequency by the header frequency. To work out how much we should divide the cost of the scalar block by, we return the inverse of that.
Trying out this change on our sample loop, first we’ll see the debug output from BlockFrequencyInfo as it’s computed:
$ opt -p loop-vectorize -mtriple riscv64 -mattr=+v nested.ll -disable-output -debug
...
block-frequency-info: nested
 - entry: float = 1.0, int = 562949953421312
 - loop: float = 32.0, int = 18014398509481984
 - then.0: float = 16.0, int = 9007199254740992
 - then.1: float = 8.0, int = 4503599627370496
 - latch: float = 32.0, int = 18014398509481984
 - exit: float = 1.0, int = 562949953421312
loop is the header block and then.1 is the nested if block, and
with BlockFrequencyInfo’s frequency we get a probability of 8/32 =
0.25. So we would expect then.1’s scalar cost to be divided by 4:
...
LV: Found an estimated cost of 0 for VF 1 For instruction:   %iv = phi i32 [ 0, %entry ], [ %iv.next, %latch ]
LV: Found an estimated cost of 0 for VF 1 For instruction:   br i1 %c0, label %then.0, label %latch
LV: Found an estimated cost of 0 for VF 1 For instruction:   br i1 %c1, label %then.1, label %latch
LV: Found an estimated cost of 0 for VF 1 For instruction:   %gep0 = getelementptr i32, ptr %p0, i32 %iv
LV: Found an estimated cost of 1 for VF 1 For instruction:   %x = load i32, ptr %gep0, align 4
LV: Found an estimated cost of 0 for VF 1 For instruction:   %gep1 = getelementptr i32, ptr %p1, i32 %x
LV: Found an estimated cost of 1 for VF 1 For instruction:   store i32 0, ptr %gep1, align 4
LV: Found an estimated cost of 0 for VF 1 For instruction:   br label %latch
LV: Found an estimated cost of 1 for VF 1 For instruction:   %iv.next = add i32 %iv, 1
LV: Found an estimated cost of 1 for VF 1 For instruction:   %done = icmp eq i32 %iv.next, 1024
LV: Found an estimated cost of 0 for VF 1 For instruction:   br i1 %done, label %exit, label %loop
LV: Scalar loop costs: 2.
...
Cost for VF vscale x 4: 17 (Estimated cost per lane: 2.1)
...
LV: Selecting VF: 1.
LV: Vectorization is possible but not beneficial.
then.1s scalar cost is now 2/4 = 0, so the total cost of the
scalar loop is now 2 and the loop vectorizer no longer decides to
vectorize. If we try this out on 538.deepsjeng_r, we can see that it
no longer vectorizes that loop in qsearch either. Success!
Running it again on LNT showed a ~7% speedup in execution time. Not just as fast as GCC yet, but a welcome improvement for only a handful of lines of code.
Upstreaming
Now that we know the fix we want to land, we can start to think about how we want to upstream this into LLVM.
If we run llvm-lit --update-tests
llvm/test/Transforms/LoopVectorize, we actually get quite a few
unexpected test changes. One of the side effects of using
BlockFrequencyInfo is that tail folded loops no longer discount the
scalar loop if it wasn’t predicated to begin
with. A tail folded
loop is a loop where the scalar epilogue is folded into the vector loop itself by predicating the vector operations:
// non-tail folded loop:
// process as many VF sized vectors that fit in n
for (int i = 0; i < n - (n % VF); i += VF)
  x[i..i+VF] = y[i..i+VF];
// process the remaining n % VF scalar elements
for (int i = n - (n % VF); i < n; i++)
  x[i] = y[i];
// tail folded loop:
for (int i = 0; i < n; i += VF)
  x[i..i+VF] = y[i..i+VF] mask=[i<n, i+1<n, ..., i+VF-1<n];
However because this block is technically predicated due to the mask
on the vector instructions, the loop vectorizer applied
getPredBlockCostDivisor to the scalar loop cost even if the original
scalar loop had no control flow in its body. BlockFrequencyInfo here
can detect that if the block had no control flow, its probability of
being executed is 1 and so the scalar loop cost isn’t made cheaper
than it needs to be. I split off and landed this change separately,
since it makes the test changes easier to review.
Now that the remaining changes in llvm/test/Transforms/LoopVectorize
looked more contained, I was almost ready to open a pull request. I
just wanted to quickly kick the tyres on
llvm-test-suite with a few
other targets, since this wasn’t a RISC-V specific change. The plan
was to quickly collect some stats on how many loops were vectorized,
check for any anomalies when compared to beforehand, and then be on
our way:
$ cd llvm-test-suite
$ ninja -C build
...
[222/7278] Building C object External/...nchspec/CPU/500.perlbench_r/src/pp.c.o
FAILED: External/SPEC/CINT2017rate/500.perlbench_r/CMakeFiles/500.perlbench_r.dir/root/cpu2017/benchspec/CPU/500.perlbench_r/src/pp.c.o
/root/llvm-test-suite/build.x86_64-ReleaseLTO-a/tools/timeit --summary External/SPEC/CINT2017rate/500.perlbench_r/CMakeFiles/500.perlbench_r.dir/root/cpu2017/benchspec/CPU/500.perlbench_r/src/pp.c.o.time /root/llvm-project/build/bin/clang -DDOUBLE_SLASHES_SPECIAL=0 -DNDEBUG -DPERL_CORE -DSPEC -DSPEC_AUTO_BYTEORDER=0x12345678 -DSPEC_AUTO_SUPPRESS_OPENMP -DSPEC_CPU -DSPEC_LINUX -DSPEC_LINUX_X64 -DSPEC_LP64 -DSPEC_SUPPRESS_OPENMP -D_FILE_OFFSET_BITS=64 -D_LARGEFILE_SOURCE -D_LARGE_FILES -I/root/cpu2017/benchspec/CPU/500.perlbench_r/src -I/root/cpu2017/benchspec/CPU/500.perlbench_r/src/dist/IO -I/root/cpu2017/benchspec/CPU/500.perlbench_r/src/cpan/Time-HiRes -I/root/cpu2017/benchspec/CPU/500.perlbench_r/src/cpan/HTML-Parser -I/root/cpu2017/benchspec/CPU/500.perlbench_r/src/ext/re -I/root/cpu2017/benchspec/CPU/500.perlbench_r/src/specrand -march=x86-64-v3 -save-temps=obj     -O3 -fomit-frame-pointer -flto -DNDEBUG   -w -Werror=date-time -save-stats=obj -save-stats=obj -fno-strict-aliasing -MD -MT External/SPEC/CINT2017rate/500.perlbench_r/CMakeFiles/500.perlbench_r.dir/root/cpu2017/benchspec/CPU/500.perlbench_r/src/pp.c.o -MF External/SPEC/CINT2017rate/500.perlbench_r/CMakeFiles/500.perlbench_r.dir/root/cpu2017/benchspec/CPU/500.perlbench_r/src/pp.c.o.d -o External/SPEC/CINT2017rate/500.perlbench_r/CMakeFiles/500.perlbench_r.dir/root/cpu2017/benchspec/CPU/500.perlbench_r/src/pp.c.o -c /root/cpu2017/benchspec/CPU/500.perlbench_r/src/pp.c
PLEASE submit a bug report to https://github.com/llvm/llvm-project/issues/ and include the crash backtrace, preprocessed source, and associated run script.
Stack dump:
0.      Program arguments: /root/llvm-project/build/bin/clang-19 -cc1 -triple x86_64-unknown-linux-gnu -O3 -emit-llvm-bc -flto=full -flto-unit -save-temps=obj -disable-free -clear-ast-before-backend -main-file-name pp.c -mrelocation-model pic -pic-level 2 -pic-is-pie -mframe-pointer=none -relaxed-aliasing -fmath-errno -ffp-contract=on -fno-rounding-math -mconstructor-aliases -funwind-tables=2 -target-cpu x86-64-v3 -debugger-tuning=gdb -fdebug-compilation-dir=/root/llvm-test-suite/build.x86_64-ReleaseLTO-a -fcoverage-compilation-dir=/root/llvm-test-suite/build.x86_64-ReleaseLTO-a -resource-dir /root/llvm-project/build/lib/clang/23 -Werror=date-time -w -ferror-limit 19 -fgnuc-version=4.2.1 -fskip-odr-check-in-gmf -vectorize-loops -vectorize-slp -stats-file=External/SPEC/CINT2017rate/500.perlbench_r/CMakeFiles/500.perlbench_r.dir/root/cpu2017/benchspec/CPU/500.perlbench_r/src/pp.stats -faddrsig -fdwarf2-cfi-asm -o External/SPEC/CINT2017rate/500.perlbench_r/CMakeFiles/500.perlbench_r.dir/root/cpu2017/benchspec/CPU/500.perlbench_r/src/pp.c.o -x ir External/SPEC/CINT2017rate/500.perlbench_r/CMakeFiles/500.perlbench_r.dir/root/cpu2017/benchspec/CPU/500.perlbench_r/src/pp.bc
1.      Optimizer
2.      Running pass "function<eager-inv>(float2int,lower-constant-intrinsics,chr,loop(loop-rotate<header-duplication;prepare-for-lto>,loop-deletion),loop-distribute,inject-tli-mappings,loop-vectorize<no-interleave-forced-only;no-vectorize-forced-only;>,infer-alignment,loop-load-elim,instcombine<max-iterations=1;no-verify-fixpoint>,simplifycfg<bonus-inst-threshold=1;forward-switch-cond;switch-range-to-icmp;switch-to-arithmetic;switch-to-lookup;no-keep-loops;hoist-common-insts;no-hoist-loads-stores-with-cond-faulting;sink-common-insts;speculate-blocks;simplify-cond-branch;no-speculate-unpredictables>,slp-vectorizer,vector-combine,instcombine<max-iterations=1;no-verify-fixpoint>,loop-unroll<O3>,transform-warning,sroa<preserve-cfg>,infer-alignment,instcombine<max-iterations=1;no-verify-fixpoint>,loop-mssa(licm<allowspeculation>),alignment-from-assumptions,loop-sink,instsimplify,div-rem-pairs,tailcallelim,simplifycfg<bonus-inst-threshold=1;no-forward-switch-cond;switch-range-to-icmp;switch-to-arithmetic;no-switch-to-lookup;keep-loops;no-hoist-common-insts;hoist-loads-stores-with-cond-faulting;no-sink-common-insts;speculate-blocks;simplify-cond-branch;speculate-unpredictables>)" on module "External/SPEC/CINT2017rate/500.perlbench_r/CMakeFiles/500.perlbench_r.dir/root/cpu2017/benchspec/CPU/500.perlbench_r/src/pp.bc"
3.      Running pass "loop-vectorize<no-interleave-forced-only;no-vectorize-forced-only;>" on function "Perl_pp_coreargs"
 #0 0x0000556ff93ab158 llvm::sys::PrintStackTrace(llvm::raw_ostream&, int) (/root/llvm-project/build/bin/clang-19+0x2d5c158)
 #1 0x0000556ff93a8835 llvm::sys::RunSignalHandlers() (/root/llvm-project/build/bin/clang-19+0x2d59835)
 #2 0x0000556ff93abf01 SignalHandler(int, siginfo_t*, void*) Signals.cpp:0:0
 #3 0x00007f305ce49df0 (/lib/x86_64-linux-gnu/libc.so.6+0x3fdf0)
 #4 0x0000556ffaa0dbfb llvm::LoopVectorizationCostModel::expectedCost(llvm::ElementCount) (/root/llvm-project/build/bin/clang-19+0x43bebfb)
 #5 0x0000556ffaa22a0d llvm::LoopVectorizationPlanner::computeBestVF() (/root/llvm-project/build/bin/clang-19+0x43d3a0d)
 #6 0x0000556ffaa36f3b llvm::LoopVectorizePass::processLoop(llvm::Loop*) (/root/llvm-project/build/bin/clang-19+0x43e7f3b)
 #7 0x0000556ffaa413eb llvm::LoopVectorizePass::runImpl(llvm::Function&) (/root/llvm-project/build/bin/clang-19+0x43f23eb)
 ...
...
A crash when building for X86. No assertion message, but a backtrace that points to the loop vectorizer cost model. Unfortunately this did not turn out to be simple to debug and instead turned into a whole other ordeal, so I’ll leave the details of that rabbit hole to the next post. But in the meantime, here are some hints if you want to guess what went wrong:
- The crash stems from a SIGFPE signal
- It only occurs when building on X86. Building on AArch64 is unaffected, even when cross-compiling to X86
- It only occurs with LTO
Hopefully this also gives a bit of insight into the type of upstream work that we carry out at Igalia. If you have an LLVM or RISC-V project that we could help with, feel free to reach out.
-
The scalar loop is also modeled in VPlan, but currently costed with the legacy cost model and not the VPlan itself. This is another load bearing TODO. ↩
-
Whilst not enabled default, there is experimental support for outer loop vectorization in the VPlan native path. ↩