Closing the LLVM RISC-V gap to GCC, part 1
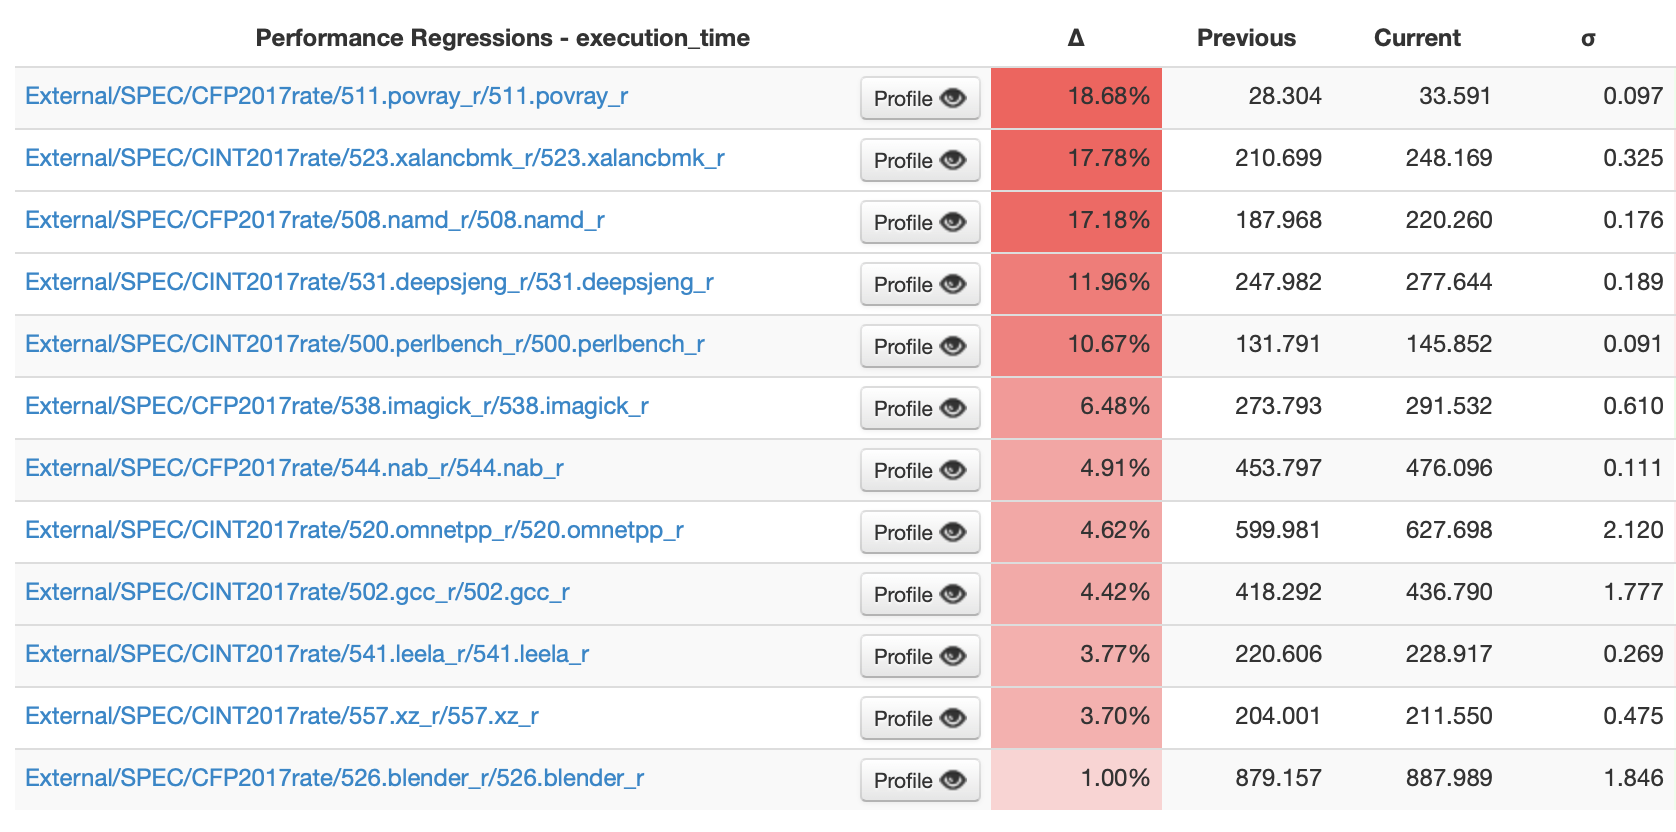
At the time of writing, GCC beats Clang on several SPEC CPU 2017 benchmarks on RISC-V1:
LLVM developers upstream have been working hard on the performance of generated code, in every part of the pipeline from the frontend all the way through to the backend. So when we first saw these results we were naturally a bit surprised. But as it turns out, the GCC developers have been hard at work too.
Sometimes a bit of healthy competition isn’t a bad thing, so this blog post is the first in a series looking at the work going on upstream to improve performance and catch up to GCC.
Please note that this series focuses on RISC-V. Other targets may have
more competitive performance but we haven’t measured them yet. We’ll
specifically be focusing on the high-performance application processor
use case for RISC-V, e.g. compiling for a
profile like
RVA23. Unfortunately since we don’t have access to RVA23 compatible
hardware just yet we’ll be benchmarking on a SpacemiT-X60 powered
Banana Pi BPI-F3 with -march=rva22u64_v. We don’t want to use
-mcpu=spacemit-x60 since we want to emulate a portable configuration
that an OS distribution might compile packages with. And we want to
include the vector extension, as we’ll see in later blog posts that
optimization like auto-vectorization can have a major impact on
performance.
Where to start?
It goes without saying that a vague task like “make LLVM faster” is easier said than done. The first thing is to find something to make fast, and while you could read through the couple dozen million lines of code in LLVM until inspiration strikes, it’s generally easier to start the other way around by analyzing the code it generates.
Sometimes you’ll get lucky by just stumbling across something that could be made faster when hacking or poring through generated assembly. But there’s an endless amount of optimizations to be implemented and not all of them are equally impactful. If we really want to make large strides in performance we need to take a step back and triage what’s actually worth spending time on.
LNT, LLVM’s nightly testing infrastructure, is a great tool for this task. It’s both a web server that allows you to analyze benchmark results, and a command line tool to help run the benchmarks and submit the results to said web server.
As the name might imply, it’s normally used for detecting performance regressions by running benchmarks daily with the latest revision of Clang, flagging any tests that may have become slower or faster since the last revision.
But it also allows you to compare benchmark results across arbitrary configurations. You can run experiments to see what effects a flag has, or see the difference in performance on two pieces of hardware.
Moreover, you can pass in different compilers. In our case, we can do two “runs” with Clang and GCC. Here’s how we would kick these off:
for CC in clang riscv64-linux-gnu-gcc
do
  lnt runtest test-suite bpi-f3-rva22u64_v-ReleaseLTO \
    --sandbox /var/lib/lnt/ \
    --test-suite=path/to/llvm-test-suite \
    -DTEST_SUITE_SPEC2017_ROOT=path/to/cpu2017 \
    --cc=$CC \
    --cflags="-O3 -flto -march=rva22u64_v" \
    --cxxflags="-O3 -flto -march=rva22u64_v" \
    --benchmarking-only \
    --build-threads=16 \
    # cross-compile and run on another machine over ssh
    --toolchain=rva22u64_v.cmake \
    --remote-host=bpi-f3 \
    # fight noise, run each benchmark 3 times on the same core
    --exec-multisample=3 \
    --run-under="taskset -c 5" \
    # submit the results to a web server for easy viewing
    --submit=https://mylntserver.com/submitRun
done
This command does a lot of heavy lifting. First off it invokes CMake
to configure a new build of llvm-test-suite and SPEC CPU 2017 with
-O3 -flto -march=rva22u64_v. But because compiling the benchmarks
on the Banana Pi BPI-F3 would be painfully slow, we’ve specified a
CMake toolchain
file
to cross-compile to riscv64-linux-gnu from an x86-64 build
machine. Here’s what the toolchain file looks like:
# rva22u64_v.cmake
set(CMAKE_SYSTEM_NAME Linux)
set(CMAKE_C_COMPILER_TARGET riscv64-linux-gnu)
set(CMAKE_CXX_COMPILER_TARGET riscv64-linux-gnu)
set(ARCH riscv64)
If you’ve got your cross toolchain sysroots set up in the right place
in /usr/riscv64-linux-gnu/, things should “just work” and CMake will
magically build RISC-V binaries. On Debian distros you can install the
*-cross packages for this:
$ apt install libc6-dev-riscv64-cross libgcc-14-dev-riscv64-cross
libstdc++-12-dev-riscv64-cross
(You could also use mmdebstrap, or see Alex Bradbury’s guide to this)
After the benchmarks are built it rsyncs over the binaries to the
remote machine, and then sshes into it to begin running the
benchmarks. It will expect the sandbox path where the binaries are
built on the remote to also exist on the host, so something like
/var/lib/lnt should work across both. The BPI-F3 can also produce
some noisy results, so the --exec-multisample=3 and
-run-under="taskset -c 5" tell it to run the benchmarks multiple
times and pin them to the same core.
Finally it generates a report.json file and submits it to the web
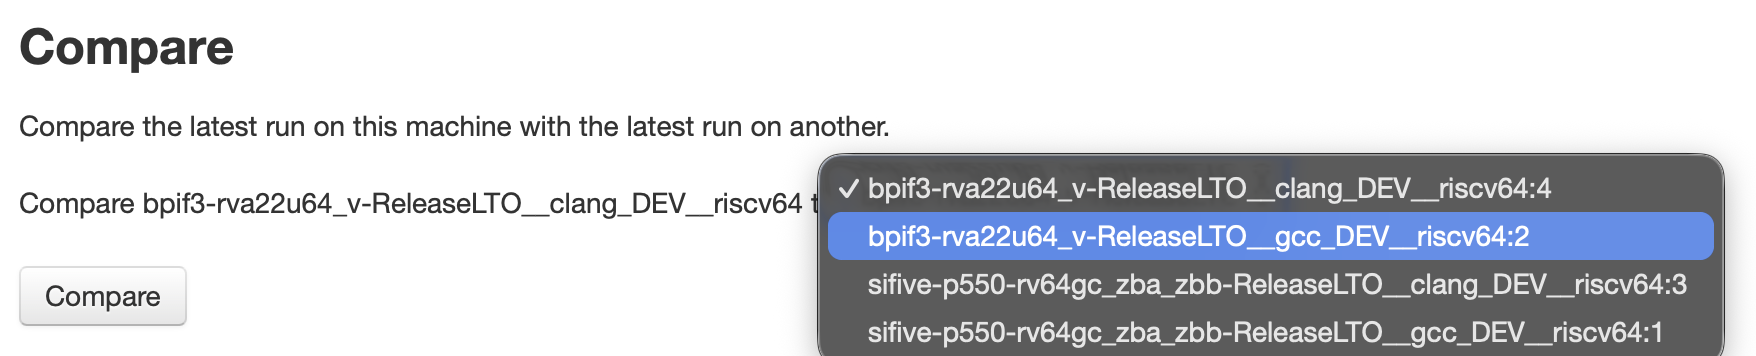
server of choice. Navigate to the web interface and you’ll be shown
two “machines”, LNT’s parlance for a specific combination of hardware,
compiler and flags. You should see something like:
bpif3-rva22u64_v-ReleaseLTO__clang_DEV__riscv64 and
bpif3-rva22u64_v-ReleaseLTO__gcc_DEV__riscv64. Clicking into one of
these machines will allow you to compare it against the other.
Profiling
Once on the LNT web interface you’ll be presented with a list of benchmarks with a lot of red percentages beside them. We now know what is slower, but next we need to know why they’re slower. We need to profile these benchmarks to see where all the cycles are spent and to figure out what Clang is doing differently from GCC.
LNT makes this easy, all you need to do is add --use-perf=profile to
the lnt runtest invocation and it will perform an additional run of
each benchmark wrapped in perf record. Profiling impacts run time so
it runs it separately to avoid interfering with the final results. If
you want to override the default events that are sampled you can
specify them with --perf-events=cycles:u,instructions:u,....
LNT will take care of copying back the collected profiles to the host machine and encoding them in the report, and in the web interface you’ll notice a “Profile” button beside the benchmark. Click on that and you’ll be brought to a side by side comparison of the profiles from the two machines:
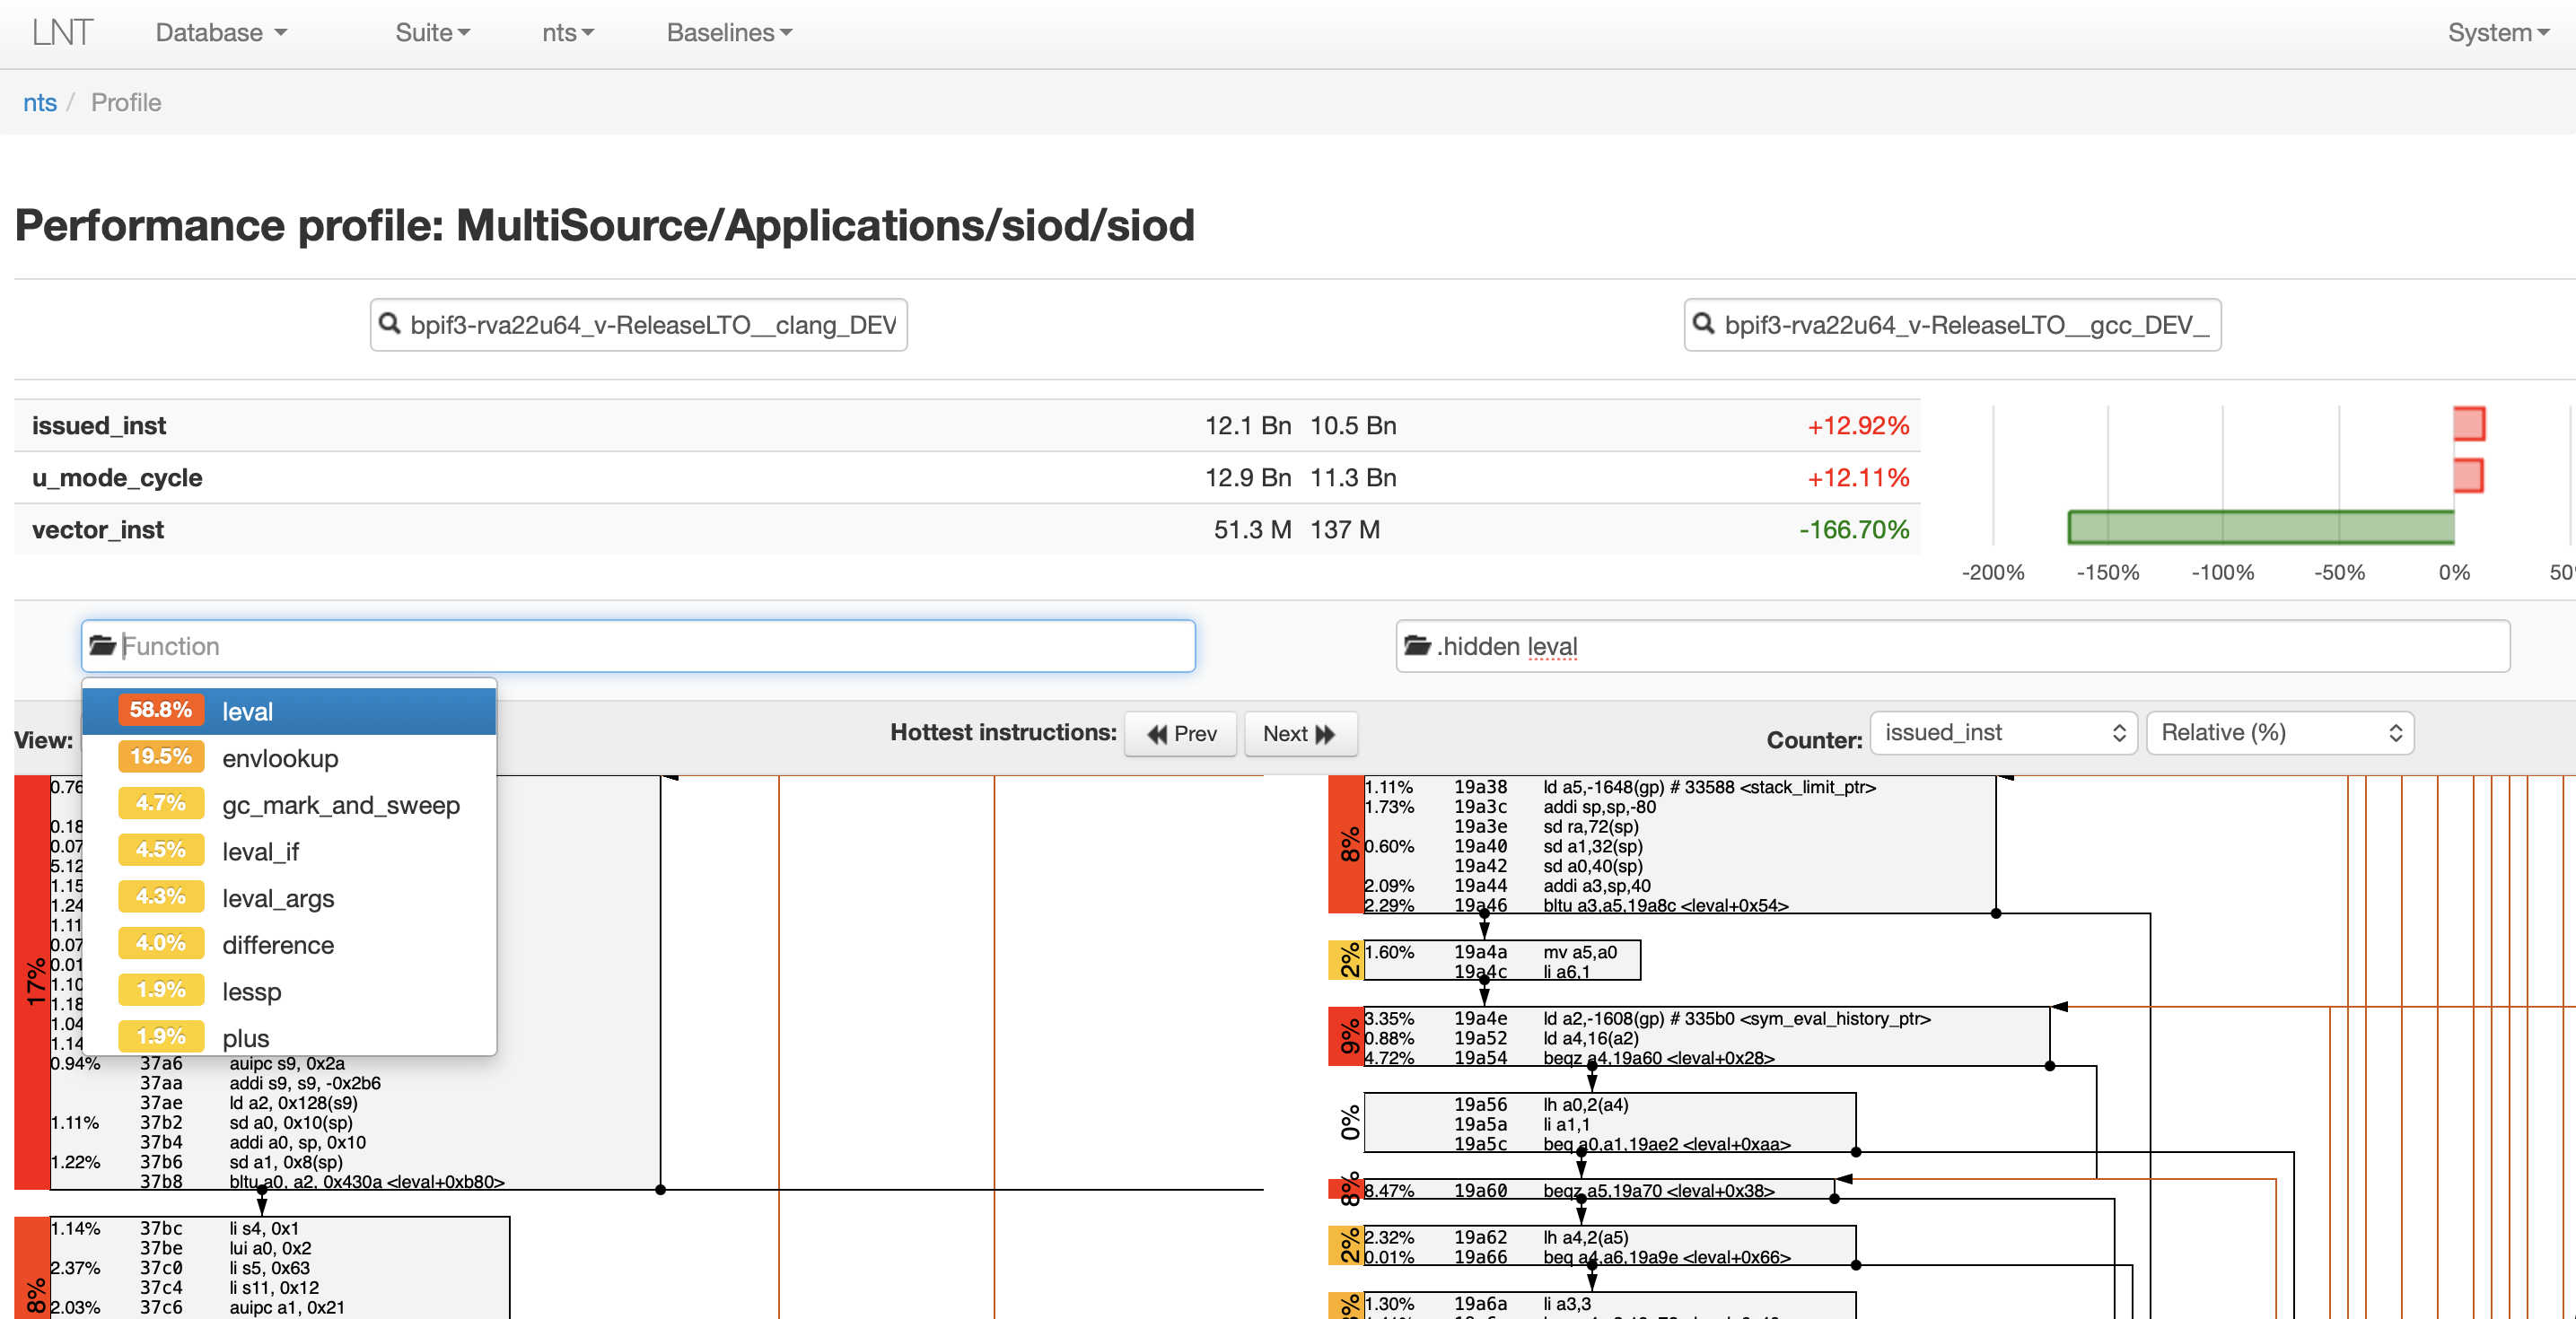
From here you can dive in and see where the benchmark spends most of
its time. Select a function from the dropdown and choose one with a
particularly high percentage: This is how much it makes up overall of
whatever counter is active in the top right, like cycles or
instructions. Then do the same for the other run and you’ll be
presented with the disassemblies side-by-side below. Most importantly,
information about the counters is displayed inline with each
instruction, much like the output of perf annotate.
You might find the per-instruction counter cycle information to be a bit too fine-grained, so personally I like to use the “Control-Flow Graph” view mode in the top left. This groups the instructions into blocks and lets you see which blocks are the hottest. It also shows the edges between branches and their destinations which makes identifying loops a lot easier.
A real example
Lets take a look at how we can use LNT’s web interface to identify something that GCC does but Clang doesn’t (but should). Going back to the list of SPEC benchmark results we can see 508.namd_r is about 17% slower, so hopefully we should find something to optimize in there.
Jumping into the profile we can see there’s a bunch of functions that
all contribute a similar amount to the runtime. We’ll just pick the
hottest one at 14.3%,
ComputeNonbondedUtil::calc_pair_energy_fullelect(nonbonded*). It’s a
pretty big function, but in GCC’s profile 71% of the dynamic
instruction count comes from this single, albiet large block.
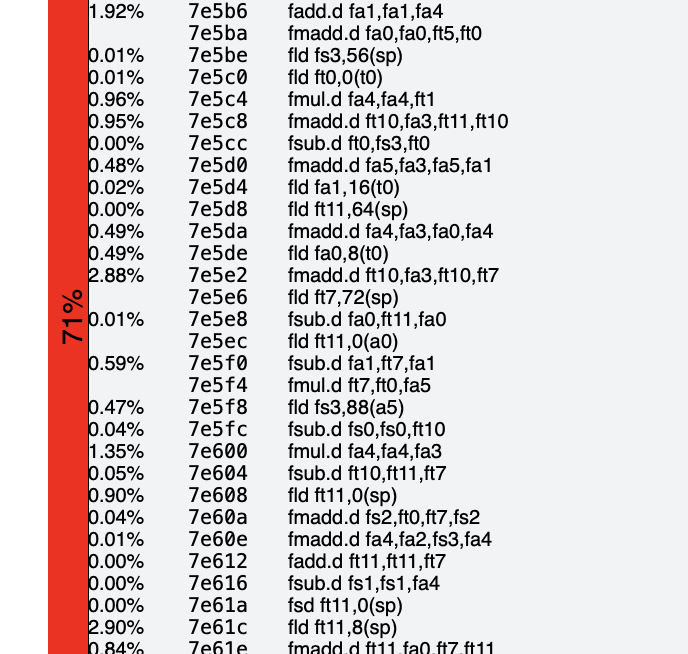
Looking at Clang’s profile on the opposite side we see a similar block
that accounts for 85% of the function’s instruction count. This
slightly higher proportion is a small hint that the block that Clang’s
producing is sub-optimal. If we take the hint and stare at it for long
enough, one thing starts to stand out is that Clang generates a
handful of fneg.d instructions which GCC doesn’t:
	fneg.d  fa0, fa0
	fneg.d  ft0, ft0
	fneg.d  ft2, ft2
	fmul.d  fa3, ft5, fa3
	fmul.d  fa0, fa3, fa0
	fmul.d  ft0, fa3, ft0
	fmul.d  fa3, fa3, ft2
	fmadd.d fa2, fa4, fa2, fa0
	fmadd.d ft6, fa4, ft6, ft0
	fmadd.d fa4, fa4, ft1, fa3
fneg.d rd, rs1 negates a double and fmul.d multiplies two
doubles. fmadd.d rd, rs1, rs2, rs3 computes (rs1*rs2)+rs3, so here
we’re doing some calculation like (a*b)+(c*-d).
These fneg.ds and fmadd.ds are missing on GCC. Instead it emits
fmsub.d, which is entirely absent from the Clang code:
	fmul.d fa1,fa4,fa1
	fmul.d ft10,fa4,fa5
	fmsub.d ft10,ft7,fa0,ft10
	fmsub.d fa5,ft7,fa5,fa1
	fmul.d fa1,fa4,fa1
	fmsub.d fa1,ft7,fa0,fa1
fmsub.d rd, rs1, rs2, rs3 computes (rs1*rs2)-rs3, so GCC is
instead doing something like (a*b)-(c*d) and in doing so avoids the
need for the fneg.d. This sounds like a missed optimization in LLVM,
so lets take a look at fixing it.
Writing the (right) fix
The LLVM RISC-V scalar backend is pretty mature at this stage so it’s
surprising that we aren’t able to match fmsub.d. But if you take a
look in RISCVInstrInfoD.td, you’ll see that the pattern already
exists:
// fmsub: rs1 * rs2 - rs3
def : Pat<(any_fma FPR64:$rs1, FPR64:$rs2, (fneg FPR64:$rs3)),
          (FMSUB_D FPR64:$rs1, FPR64:$rs2, FPR64:$rs3, FRM_DYN)>;
We’ll need to figure out why this pattern isn’t getting selected, so lets start by extracting the build commands so we can look under the hood and dump the LLVM IR:
$ cmake -B build -C cmake/caches/ReleaseLTO.cmake --toolchain=...
$ ninja -C build 508.namd_r -t clean
$ ninja -C build 508.namd_r -v
...
[44/45] : && llvm-project/build.release/bin/clang++ --target=riscv64-linux-gnu -march=rva22u64_v -O3 -fomit-frame-pointer -flto -DNDEBUG -fuse-ld=lld ... -o External/SPEC/CFP2017rate/508.namd_r/508.namd_r
This is an LTO build so the code generation step is actually happening
during link time. To dump the IR we can copy and paste the link
command from the verbose output and append -Wl,--save-temps to it,
which in turn tells the Clang driver to pass --save-temps to the
linker2.
$ llvm-project/build.release/bin/clang++ -Wl,--save-temps --target=riscv64-linux-gnu -march=rva22u64_v -O3 -fomit-frame-pointer -flto -DNDEBUG -fuse-ld=lld ... -o External/SPEC/CFP2017rate/508.namd_r/508.namd_r
$ ls External/SPEC/CFP2017rate/508.namd_r/508.namd_r*
External/SPEC/CFP2017rate/508.namd_r/508.namd_r
External/SPEC/CFP2017rate/508.namd_r/508.namd_r.0.0.preopt.bc
External/SPEC/CFP2017rate/508.namd_r/508.namd_r.0.2.internalize.bc
External/SPEC/CFP2017rate/508.namd_r/508.namd_r.0.4.opt.bc
External/SPEC/CFP2017rate/508.namd_r/508.namd_r.0.5.precodegen.bc
The bitcode is dumped at various stages, and
508.namd_r.0.5.precodegen.bc is the particular stage we’re looking
for. This is after all the middle-end optimisations have run and is as
close as we’ll get before the backend begins. It contains the bitcode
for the entire program though, so lets find the symbol for the C++
function and extract just that corresponding LLVM IR function:
$ llvm-objdump -t 508.namd_r | grep calc_pair_energy_fullelect
...
000000000004562e l     F .text	0000000000001c92 _ZN20ComputeNonbondedUtil26calc_pair_energy_fullelectEP9nonbonded
$ llvm-extract -f 508.namd_r.0.5.precodegen.bc --func _ZN20ComputeNonbondedUtil26calc_pair_energy_fullelectEP9nonbonded \
  | llvm-dis > calc_pair_energy_fullelect.precodegen.ll
Now quickly grep the disassembled LLVM IR to see if we can find the
source of the fnegs:
  %316 = fneg double %315
  %neg = fmul double %mul922, %316
  %317 = tail call double @llvm.fmuladd.f64(double %mul919, double %314, double %neg)
This looks promising. We have a @llvm.fmuladd that’s being fed by a
fmul of a fneg, which is similar to the (a*b)+(c*-d) pattern in
the resulting assembly. But looking back to our TableGen pattern for
fmsub.d, we want (any_fma $rs1, $rs2, (fneg $rs3)), i.e. a
llvm.fmuladd fed by a fneg of a fmul.
One thing about floating point arithmetic is that whilst it’s
generally not associative, we can hoist out the fneg from the fmul
since all negation does is flip the sign bit. So we can try to teach
InstCombine to hoist the fneg outwards like (fmul x, (fneg y)) ->
(fneg (fmul x, y)). But if we go to try that out we’ll see that
InstCombine already does the exact opposite:
Instruction *InstCombinerImpl::visitFNeg(UnaryOperator &I) {
  Value *Op = I.getOperand(0);
  // ...
  Value *OneUse;
  if (!match(Op, m_OneUse(m_Value(OneUse))))
    return nullptr;

  if (Instruction *R = hoistFNegAboveFMulFDiv(OneUse, I))
    return replaceInstUsesWith(I, R);
  // ...
}

Instruction *InstCombinerImpl::hoistFNegAboveFMulFDiv(Value *FNegOp,
                                                      Instruction &FMFSource) {
  Value *X, *Y;
  if (match(FNegOp, m_FMul(m_Value(X), m_Value(Y)))) {
    // Push into RHS which is more likely to simplify (const or another fneg).
    // FIXME: It would be better to invert the transform.
    return cast<Instruction>(Builder.CreateFMulFMF(
        X, Builder.CreateFNegFMF(Y, &FMFSource), &FMFSource));
  }
InstCombine usually has good reasons for canonicalizing certain IR
patterns, so we need to seriously reconsider if we want to change the
canonical form. InstCombine affects all targets and it could be the
case that some other backends have patterns that match fmul (fneg x,
y), in which case we don’t want disturb them. However for RISC-V we
know what our patterns for instruction selection are and what form we
want our incoming IR to be in. So a much better place to handle this
in is in RISCVISelLowering.cpp, which lets us massage it into shape at
the SelectionDAG level, in a way that’s localized to just our
target. “Un-canonicalizing” the IR is a common task that backends end
up performing, and this is what the resulting
patch ended up
looking like:
--- a/llvm/lib/Target/RISCV/RISCVISelLowering.cpp
+++ b/llvm/lib/Target/RISCV/RISCVISelLowering.cpp
@@ -20248,6 +20248,17 @@ SDValue RISCVTargetLowering::PerformDAGCombine(SDNode *N,
       return V;
     break;
   case ISD::FMUL: {
+    using namespace SDPatternMatch;
+    SDLoc DL(N);
+    EVT VT = N->getValueType(0);
+    SDValue X, Y;
+    // InstCombine canonicalizes fneg (fmul x, y) -> fmul x, (fneg y), see
+    // hoistFNegAboveFMulFDiv.
+    // Undo this and sink the fneg so we match more fmsub/fnmadd patterns.
+    if (sd_match(N, m_FMul(m_Value(X), m_OneUse(m_FNeg(m_Value(Y))))))
+      return DAG.getNode(ISD::FNEG, DL, VT,
+                         DAG.getNode(ISD::FMUL, DL, VT, X, Y));
+
And if we rebuild our benchmark after applying it, we can see we the
fmsub.ds getting matched, saving a couple of instructions:
@@ -983,18 +983,15 @@
        fld     ft2, 48(a5)
        fld     ft3, 64(a5)
        fld     ft4, 72(a5)
-       fneg.d  fa0, fa0
-       fneg.d  ft0, ft0
-       fneg.d  ft2, ft2
        fmul.d  fa3, ft5, fa3
        fmul.d  fa0, fa3, fa0
        fmul.d  ft0, fa3, ft0
        fmul.d  fa3, fa3, ft2
        fld     ft2, 0(s1)
        fmul.d  fa4, ft5, fa4
-       fmadd.d fa2, fa4, fa2, fa0
-       fmadd.d ft6, fa4, ft6, ft0
-       fmadd.d fa4, fa4, ft1, fa3
+       fmsub.d fa2, fa4, fa2, fa0
+       fmsub.d ft6, fa4, ft6, ft0
+       fmsub.d fa4, fa4, ft1, fa3
All in all this ended up giving a 1.77% improvement in instruction count for the 508.namd_r benchmark. It’s still not nearly as fast as GCC, but we’re a little bit closer than before we started.
What’s next?
Hopefully this has given you an overview of how to identify opportunities for optimization in LLVM, and what a typical fix might look like. The analysis is really the most important part, but if you don’t feel like setting up an LNT instance yourself locally Igalia runs one at cc-perf.igalia.com3. We run llvm-test-suite and SPEC CPU 2017 nightly built with Clang and GCC on a small set of RISC-V hardware4, but hopefully to be expanded in future. Feel free to use it to investigate some of the differences between Clang and GCC yourself, and maybe you’ll find some inspiration for optimizations.
In the next post in this series I’ll talk about a performance improvement that recently landed related to cost modelling.
-
Compiled with
-march=rva22u64_v -O3 -flto, running the train dataset on a 16GB Banana Pi BPI-F3 (SpacemiT X60), with GCC and Clang from ToT on 2025-11-25. ↩ -
LLD in this case, configurable through CMake with
-DCMAKE_LINKER_TYPE=LLD. ↩ -
The LLVM foundation is also in the process of rebooting its canonical public server, which should hopefully be up and running in the coming months. ↩
-
Currently it consists of a few Banana Pi BPI-F3s and some HiFive Premier P550s, the latter of which were generously donated by RISC-V International. ↩