
There's currently a nasty memory leak in haskell-ide-engine which leaks all the cached module information about from GHC. It seems to only occur on certain platforms, but on platforms unfortunate to be affected by it, a sizeable portion memory is leaked every time the user types or edits their document. For a small module of about 60 lines, this was 30-ishMB per edit. (Yikes)
During this year's ZuriHac, Matthew Pickering, Daniel Gröber and I tried to get this sorted out once and for all: It ended up taking the entire weekend, and I learnt more about the RTS than I ever intended to.
Profiling
The first step in the investigation began with figuring out what exactly was
leaking. To do this we built hie with profiling
enabled:
This injects call site annotations into your code, and causes your executable
to be linked with one of the versions of the RTS that was built with profiling.
$ ghc -prof Main.hs
# or in our case, for cabal projects
$ cabal v2-install :hie --enable-profiling
GHC comes with a bunch of different RTS libraries, each built with a different combination of features.
$ ls `ghc --print-libdir`/rts | grep rts
libHSrts-ghc8.6.5.dylib
libHSrts.a
libHSrts_debug-ghc8.6.5.dylib
libHSrts_debug.a
libHSrts_l-ghc8.6.5.dylib
libHSrts_l.a
libHSrts_p.a
libHSrts_thr-ghc8.6.5.dylib
libHSrts_thr.a
libHSrts_thr_debug-ghc8.6.5.dylib
libHSrts_thr_debug.a
libHSrts_thr_l-ghc8.6.5.dylib
libHSrts_thr_l.a
libHSrts_thr_p.a
thr stands for threading, debug for debug, l for event
logging and p for profiling. If you pass GHC -v, you should
see -lHSrts_thr_p or equivalent when linking: We're bringing in the RTS built
with threading and profiling enabled.
Now we could profile our executable by running it with specific flags passed to
the RTS. To see what's available, we ran hie +RTS --help
...
hie:   -h<break-down> Heap residency profile (hp2ps) (output file <program>.hp)
hie:      break-down: c = cost centre stack (default)
hie:                  m = module
hie:                  d = closure description
hie:                  y = type description
hie:                  r = retainer
hie:                  b = biography (LAG,DRAG,VOID,USE)
...
Here we used use the retainer breakdown, -hr, to help us find what exactly is
being retained i.e. leaking.
We originally just configured the language client to launch hie with the flag,
but we found ourselves doing it so often that we created a test scenario with
lsp-test and automated the
process:
#!/usr/bin/env cabal
{- cabal:
build-depends: base, lsp-test
-}
import Language.Haskell.LSP.Test
import Language.Haskell.LSP.Types
import Control.Monad
main = do
  runSession ("hie +RTS -hr") fullCaps "../test" $ do
    doc <- openDoc "TestFile.hs" "haskell"
    waitForDiagnostics
    replicateM_ 20 $ do
      sendNotification TextDocumentDidSave (DidSaveTextDocumentParams doc)
      waitForDiagnostics -- wait before sending it again
Then we profiled and got some data:
$ ./Leak.hs
$ hp2ps -c hie.ps # c for colour
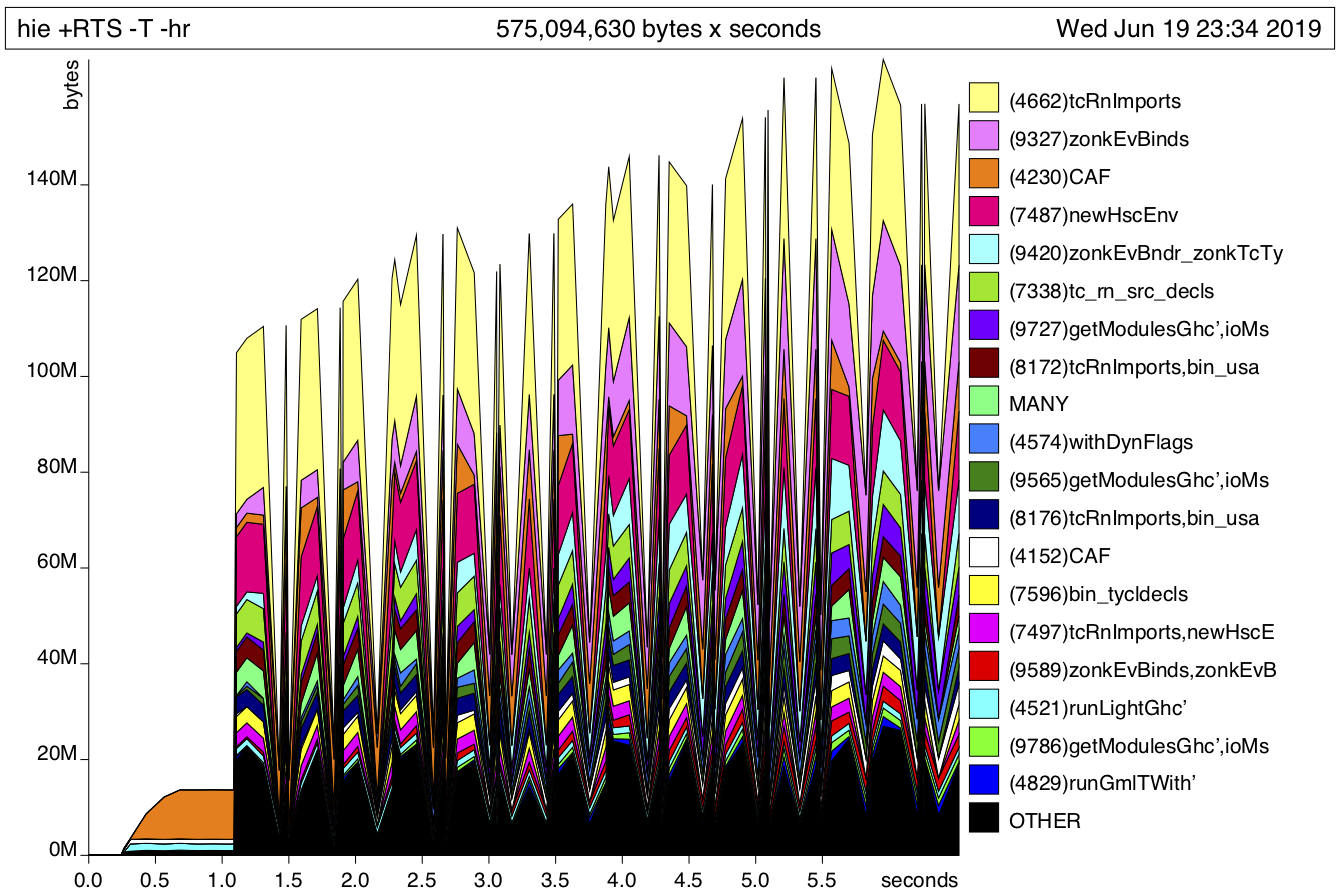
You can see tcRnImports and zonkEvBinds gradually eating up more memory over
time: These are parts of the GHC API and so I narrowed it down to most likely
coming from our UriCaches, where we store the TypecheckedModule and
ParsedModule.
type UriCaches = Map.Map FilePath UriCacheResult

data UriCacheResult = UriCacheSuccess UriCache
                    | UriCacheFailed

data UriCache = UriCache
  { cachedInfo   :: !CachedInfo
  , cachedPsMod  :: !ParsedModule
  , cachedTcMod  :: !(Maybe TypecheckedModule)
  -- | Data pertaining to the typechecked module,
  -- not the parsed module
  , cachedData   :: !(Map.Map TypeRep Dynamic)
  }
The weak pointer trap
Now that we knew what was leaking, the question turned to where was it leaking. The next steps are taken from Simon Marlow's excellent blog post, in which he details how he tracked down and fixed multiple memory leaks in GHCi.
The trick is to create a weak pointer -- a pointer that the garbage collector
ignores when looking for retainers. Point it to the offending type and store it
alongside the original, strongly referenced one.
Whenever you know the object should have been deallocated, force garbage
collection by calling performGC and dereference the weak pointer. If the
pointer is null, it was released, otherwise something is still holding onto it:
the object is being leaked.
We modified UriCache to look like the following:
data UriCacheResult = UriCacheSuccess (Weak UriCache) UriCache
                    | UriCacheFailed

mkUriCacheSuccess :: UriCache -> IO UriCacheResult
mkUriCacheSuccess uc = do
  -- second arg is callback when GC is run
  ptr <- mkWeakPtr uc Nothing
  return (UriCacheSucces ptr uc)
We knew that when caching a module in the cacheModule function, it should
replace the old cached module, so that seemed like a sensible place to add in
the performGC trap.
cacheModule = do
  -- ...
  res <- liftIO $ mkUriCacheSuccess newUc

  maybeOldUc <- Map.lookup uri' . uriCaches <$> getModuleCache

  modifyCache $ \gmc ->
      gmc { uriCaches = Map.insert uri' res (uriCaches gmc) }

  -- check leaks
  case maybeOldUc of
    Just (UriCacheSuccess wkPtr _) -> liftIO $ do
      liftIO performGC
      derefed <- deRefWeak wkPtr
      case derefed of
        Just _ -> error "Leaking!"
        Nothing -> hPutStrLn stderr "Not leaking"
    _ -> return ()
With our trap set up in place, we ran the test again.
$ ./Leak.hs
...
2019-06-20 00:01:32.650578 [ThreadId 4] - Using stack GHC version
2019-06-20 00:01:33.826226 [ThreadId 4] - Run entered for HIE(hie) Version 0.10.0.0, Git revision d679eb595a6a1583a8b63a3fdd5964f84a8d00f6 (dirty) (2801 commits) x86_64 ghc-8.6.5
2019-06-20 00:01:33.826997 [ThreadId 4] - Current directory:/Users/luke/Source/haskell-ide-engine
2019-06-20 00:01:33.836594 [ThreadId 9] - Using stack GHC version
hie: Leaking!
CallStack (from HasCallStack):
  error, called at ./Haskell/Ide/Engine/ModuleCache.hs:255:19 in hie-plugin-api-0.10.0.0-inplace:Haskell.Ide.Engine.ModuleCache
CallStack (from -prof):
  Haskell.Ide.Engine.ModuleCache.cacheModule (Haskell/Ide/Engine/ModuleCache.hs:(221,1)-(260,29))
  Haskell.Ide.Engine.ModuleCache.CAF (<entire-module>)
Nice. At this point we knew the what and the where, all we needed to know was the how.
Poking about in GDB
For this there is the convenient findPtr function included in
the debug RTS. It's a C function that we can call during runtime from a
debugger to find out what is referencing a closure. To access it we first needed
to pass two flags to GHC1 (or in our case set them in Cabal):
$ ghc -debug -fwhole-archive-hs-libs Main.hs
-debug brings in the version of RTS with debug stuff in it, whilst
-fwhole-archive-hs-libs is needed to prevent the linker from optimising out
the findPtr function: Nothing actually calls it, but we still want it
available in our final binary.
After rebuilding hie, it was time to hijack:
# after hie bombs
$ gdb -pid `pidof hie`
# alternatively, beforehand:
$ gdb -ex "set follow-fork-mode child" ./Leak.hs
Now that we were in, we needed to find out the address of the info
table:
We're looking for a symbol that ends in UriCacheSuccess_con_info.
(gdb) info functions UriCacheSuccess_con_info
All functions matching regular expression "UriCacheSuccess_con_info":

Non-debugging symbols:
0x0000000111956650  hiezmpluginzmapizm0zi10zi0zi0zminplace_HaskellziIdeziEngineziGhcModuleCache_UriCacheSuccess_con_info_dsp
0x0000000111956668  hiezmpluginzmapizm0zi10zi0zi0zminplace_HaskellziIdeziEngineziGhcModuleCache_UriCacheSuccess_con_info
We plugged in the rather gnarly
hiezmpluginzmapizm0zi10zi0zi0zminplace_HaskellziIdeziEngineziGhcModuleCache_UriCacheSuccess_con_info
into findPtr, which will go ahead and find all closures in the heap referring
to a UriCacheSuccess:
(gdb) p (void)findPtr(...UriCacheSuccess_con_info, 1)
0x4205499088 = hie-plugin-api-0.10.0.0-inplace:Haskell.Ide.Engine.GhcModuleCache.UriCacheSuccess(0x4205499139, 0x4205499110)
0x42154a88a8 = hie-plugin-api-0.10.0.0-inplace:Haskell.Ide.Engine.GhcModuleCache.UriCacheSuccess(0x42154be8d1, 0x42154a8a30)
And now we have the culprit retainers lined up right before us. We can go deeper
with another call to findPtr: here the 1 passed to it means to follow the
trail.
(gdb) p (void)findPtr(0x4205499088, 1)

== in ./Leak.hs stderr ==

0x4205499088 = hie-plugin-api-0.10.0.0-inplace:Haskell.Ide.Engine.GhcModuleCache.UriCacheSuccess(0x4205499139, 0x4205499110)
0x42154a88a8 = hie-plugin-api-0.10.0.0-inplace:Haskell.Ide.Engine.GhcModuleCache.UriCacheSuccess(0x42154be8d1, 0x42154a8a30)
0x4205499148 = THUNK(0x43b9600, 0x4205499072, 0x4205499089, 0x42154a93c1)
-->
0x42054990a0 = hie-plugin-api-0.10.0.0-inplace:Haskell.Ide.Engine.PluginsIdeMonads.IdeState(0x4205499148, 0x42154a9370, 0xc19ff3a, 0x42154a9390)
-->
0x42154be928 = TVAR(value=0x42054990a1, wq=0xc353d90, num_updates=0)
-->
0x42154be918 = base:GHC.Conc.Sync.TVar(0x42154be928)
-->
0x42154bebf8 = STACK
0x42154bf548 = FUN/1(0x43f76b0, 0x42154be919)
0x42154bf5c8 = FUN/1(0x43f76b0, 0x42154be919)
0x42001cb000 = STACK
0x42001cb000 = STACK
0x42001cb000 = STACK
0x42001cb000 = STACK
Is that an unevaluated thunk? Let's take a closer look at it.
0x4205499148 = THUNK(0x43b9600, 0x4205499072, 0x4205499089, 0x42154a93c1)
The first address we see on the right is the address of the thunk on the heap.
To the right of the = is its contents. We can see the layout of such a thunk
in GHC's source, at rts/storage/Closures.h:
typedef struct {
    StgThunkHeader  header;
    struct StgClosure_ *payload[];
} StgThunk;

typedef struct {
    const StgInfoTable* info;
#if defined(PROFILING)
    StgProfHeader         prof;
#endif
    StgSMPThunkHeader     smp;
} StgThunkHeader;

typedef struct {
    StgWord pad;
} StgSMPThunkHeader;
So the first address we're seeing, 0x43b9600, is the const StgInfoTable* info
pointer. It's then followed by a word of padding, which findPtr leaves out for
us. (The profiling enabled version of the RTS also passes about an extra word of
profiling info)
The remaining values are the free variables of the function. There's a lot more to talk about the runtime representation of thunks, , more than I could ever fit into a blog post, so I'll return to our leak.
Debugging info
We now knew the thunk that was retaining the UriCaches, but we didn't know
where it was being created. We could figure out where it's coming from by
compiling hie with debug information: not to be confused with linking with the
debug version of the RTS.
$ ghc -g3 -debug -fwhole-archive-hs-libs Main.hs
# or via cabal
# (make sure to stop cabal from just stripping it back out)
$ cabal v2-build hie --enable-debug-info --disable-executable-stripping --disable-library-stripping
# or in your cabal.project
$ cat cabal.project
packages:
    ./
debug-info: 3
executable-stripping: False
library-stripping: False
This attached source locations to the info tables, so after another rebuild and another GDB session, we could simply print out the source code listing for the closure:
0x42104e1148 = THUNK(0x43c6280, 0x42104e1072, 0x42104e1089, 0x4217654a31)

# meanwhile in gdb
(gdb) list *0x43c6280
56      -- ---------------------------------------------------------------------
57
58      modifyCache :: (HasGhcModuleCache m) => (GhcModuleCache -> GhcModuleCache) -> m ()
59      modifyCache f = do
60        mc <- getModuleCache
61        setModuleCache (f mc)
62
63      -- ---------------------------------------------------------------------
64      -- | Runs an IdeM action with the given Cradle
65      withCradle :: (GM.GmEnv m) => GM.Cradle -> m a -> m a
And there we had it: unevaluated thunks of f piling up and eating memory.
The solution for this is usually making sure to strictly evaluate the offending thunk.
We used this technique to hunt down several retainers, but be warned: stifling one retainer isn't necessarily guaranteed to fix the memory leak, as it is possible (and likely) that another retainer out exists and is still holding on.
But now we know what we're doing. We'll be using this to squash more memory leaks down the line, and hopefully you can too.
Bonus: Event logs
In addition to profiling via -hr, it's possible to capture event logs. They
can be thought of as a more modern version of the heap profiles.
If your executable was compiled with -debug, all you need to do is pass -l
alongside your regular profiling flags:
$ hie +RTS -r -l
This will produce a little exe.eventlog file which you can use with
profiling tools like ThreadScope.
Matthew Pickering has made a handy tool, eventlog2html, to convert these into interactive graphs. I'll leave you with the trace of our memory leak earlier:
- GHC 8.6.5 and earlier don't come with an RTS with both debugging and profiling enabled, so we've disable profiling here. This has been fixed in GHC 8.8. ↩